
IPSAT
HELP
Introduction
How to run IPSAT?
PLOT menu
Cartography
Time series
Statistics menu
Correlation
Inter-calibration
Trapped particles
Untrapped particles
Data/models menu
Compare w AE8/AP8
Compare w CRRESELE/CRRESPRO
Data base menu
Data coverage
Data description
? menu
Help
On-line registration
About IPSAT
Introduction
IPSAT stands for Ionising Particle in SPace Analysis
tool.
The primary goal of IPSAT is to provide an easy and a friendly way to analyse and
visualize in-situ measurements from various sources. IPSAT is
NOT
a resource to download any data but
just allows
to plot the data in different format.
The access to any IPSAT module is restricted. An access must be provided by the author
(S. Bourdarie, ONERA) and is subject to the ONERA and CNES acceptance. The access
to IPSAT modules is controlled by a user login + IP address identification.
A list and description of data available through IPSAT is listed in the "data description"
module. The philosophy of IPSAT is to allow users to plot only data they have right
for, i.e. an agreement between the PI, ONERA and the applicant must be reached for
any given data set. As a summary each users have a profile where a list of spacecraft
accessible is defined .
Several modules are now developped, the possibilities offered are described below
module by module.
How
to run IPSAT?
IPSAT is compliant with Mozilla, Firefox, Netscape, Internet Explorer 7 and Opera web browsers, thought
IPSAT has been intensively tested under Mozilla and Firefox web browsers. For
any other browser there are no garanties that it is running nicely! Note that IPSAT is
running under Internet Explorer 6 but with some limitation (time out issues), this is solved with IE7.
IPSAT web interface is developed in php and JavaScript. Before running IPSAT you have
to make sure that your browser allows JavaScript (This is necessary for example on
Mozilla web browser you have to go to
preferences then
advanced then
scripts
and pluggins and select a
ctivate JavaScript
for the browser). Next popup must be allowed for this web site.
The plot menu display two sub-menu, Cartography and Time series. Their respective
functionalities are described below.
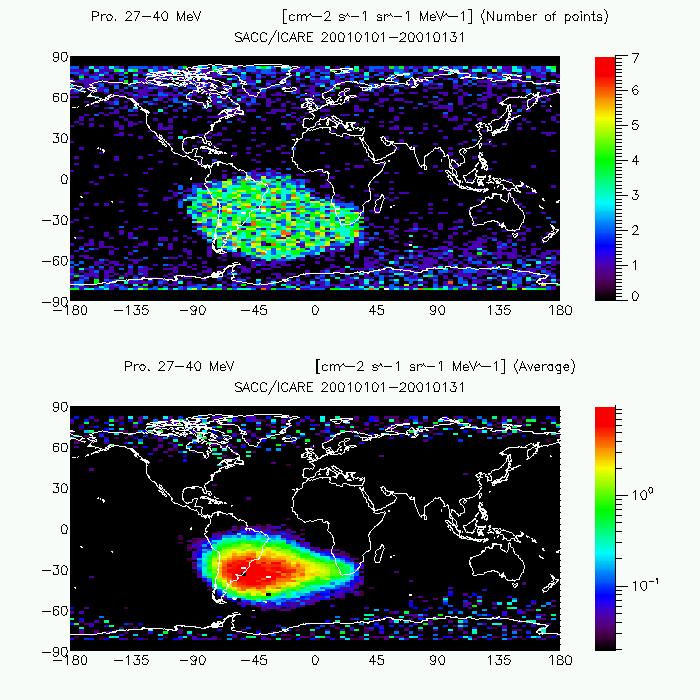
Cartography
This module allows to plot for a given spacecraft the data contained in files in color
map within a user defined time range. Any data present in the file can be selected
on the X, Y or Z axes. Data are binned in X and Y and averaged over the time period.
This module allows to do a:
-
Longitude-Latitude-Flux plot for example (see example)
-
L*-flux-Np for example to see any saturation in instrument (see
example)
-
and much more ...
Note that the access
to this module is restricted.
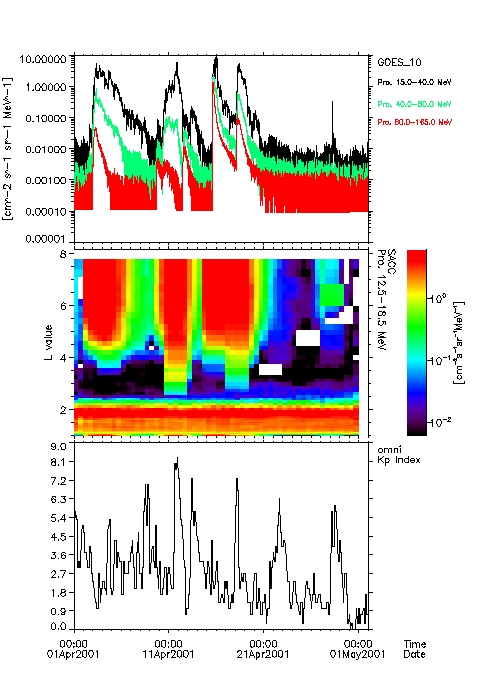
Time
series
This module allows to compose plots from various spacecraft/data versus a common axes:
the time. All data series are synchronyzed in times and can be therefore easily compared
(
see example).
This module allows to do a plot composed of:
-
Any flux or spacecraft ephemeris versus time
-
L*versus time flux map (overview)
-
Omni parameters (i.e. Kp, Dst, Solar wind speed, solar wind density ...)
Note that the access
to this module is restricted.
Statistics
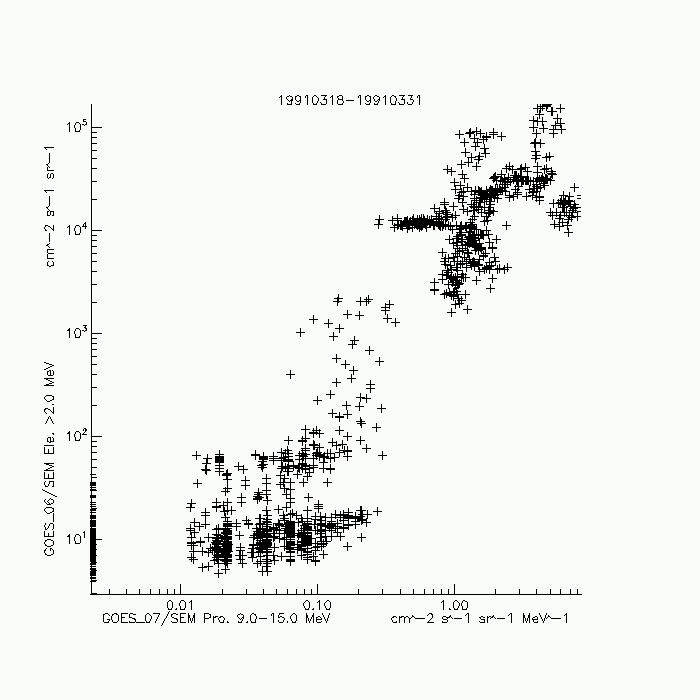
Correlation
This module allows to plot correlation of any flux measurements done on a given spacecraft
versus any flux measurements done on another given spacecraft (or the same one). This
is very usefull to determine weather a channel is contaminated or not and how is this
channel contaminated (
see example).
Note
that the access to this module is restricted.
Inter-calibrations
The plot menu display two sub-menu, Trapped particles and Untrapped particles. Their
respective functionalities are described below.
Trapped
particles
This module allows to find conjunction between two spacecraft under user defined conditions
and then plot the two spectrum. This is very usefull to cross calibrate two instruments.
Note
that the access to this module is restricted.
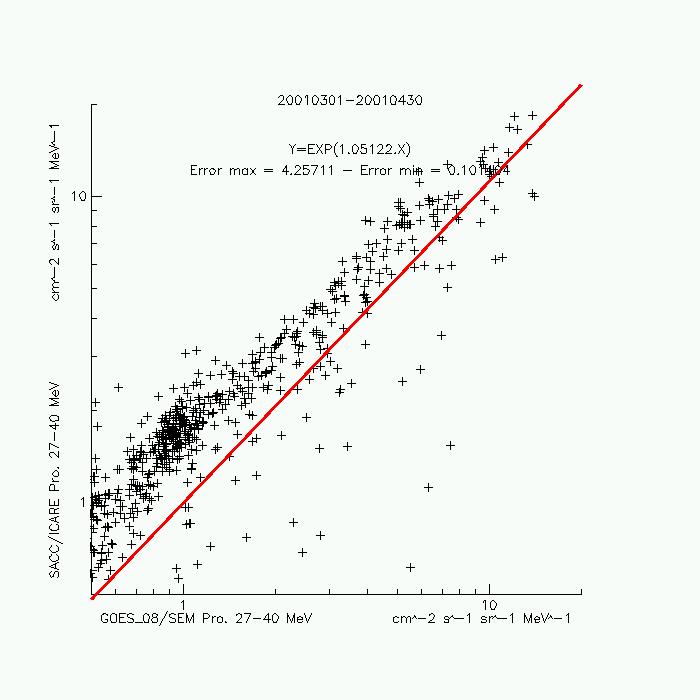
Untrapped
particles
This module allows to plot correlation of any proton flux measurements done at high
L shells on a given spacecraft versus proton flux measurements done on another given
spacecraft. The way this is done is the following: the channel selected on the first
spacecraft is computed on the second spacecraft interpolating between its measurements.
This is very usefull to cross calibrate two instruments based on solar particle events.
(
see example).
Note
that the access to this module is restricted.
Data/models
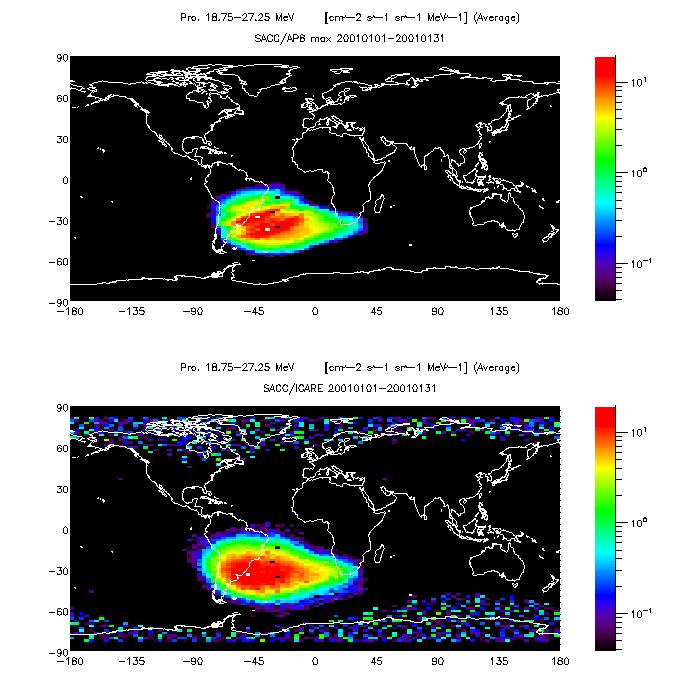
Compare
w AE8/AP8
This module allows the user to get a direct comparison between in-situ data and AE8
or AP8. The use of this module allows to fly a spacecraft (available in the database)
in the NASA model and plot the result in the same format Cartography would do with
data (
see example).
Note that the access to this module is restricted.
Compare
w CRRESELE/CRRESPRO
This module allows the user to get a direct comparison between in-situ data and CRRESELE
or CRRESPRO. The use of this module allows to fly a spacecraft (available in the database)
in the AFRL model and plot the result in the same format Cartography would do with
data (
see example).
Note that the access to this module is restricted.
Database
Data
coverage
This module allows the user to get informations on data time coverage along different
orbit (LEO, HEO, GEO, ...) on the CRATERRE web site.
Note
that the access to this module is open to public.
Data
description
This module allows the user to get informations on available data on the CRATERRE
web site. A description of the data sets is provided.
Note
that the access to this module is open to public.
?
menu
On-line
registration
To access IPSAT sofware to have to register first. This link offer an on-line registration
form.
About
IPSAT
More about IPSAT !!