EOR Environnement
Electron space environment assessment along EOR mission profile from LEO measurements
This work is supported by CNES, the French Space Agency, under Grant n° 4500072827 / DSP094.
Présentation
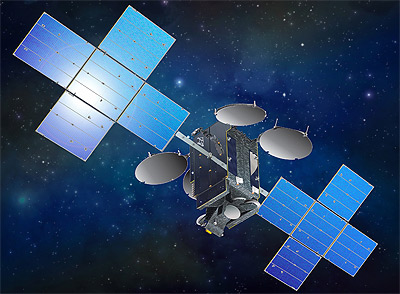
In 2019, an ICARE-NG monitor (CARMEN-4 mission) was embarked on board the Eutelsat 7C spacecraft, a GEO satellite with electrical propulsion (Electrical Orbit Raising).
The satellite was launched from Kourou by Ariane 5 on June 21, 2019. It arrived on-station on October 25, 2019.
Thanks to these four months of ICARE-NG data on this specific trajectory, it was possible to validate the estimation in the equatorial region of the electron flux levels
from the projection of measurements in LEO (ICARE-NG data from CARMEN-3 on board JASON-3 and SEM2 data on the NOAA-POES/METOP constellation). (D.Lazaro et al., "Infer electron space environment along EOR mission profile from LEO
measurements: application to EUTELSAT 7C," in IEEE Transactions on Nuclear Science, doi: 10.1109/TNS.2022.3153081).
Based on this validation, it was possible to use LEO measurements available in IPODE, i.e. SEM2 data since 1998 (NOAA-POES/METOP constellation) and ICARE-NG data since 2008 (JASON-2 and 3), to reconstruct the EOR environment over this period and
to deduce therefrom a statistic on the dynamics of the spectra thus obtained.
It is proposed here to use these same LEO measurements available in near real time in IPODE to estimate the current EOR environment.
These products allow to report on the activity of the environment on the scale of the day with
- the daily average spectrum,
- the daily activity index,
on the scale of the EOR mission with
- the average daily flux along EOR scenario,
and on the scale of the solar cycle with
- the average flux at arrival on-station.
The E7C trajectory is used here as an EOR scenario.
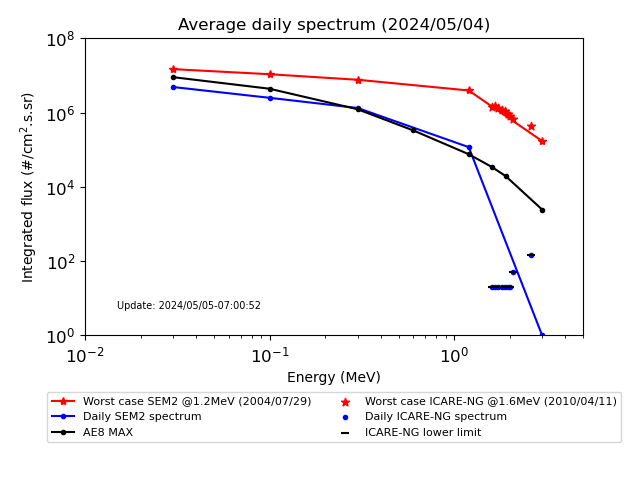
- Daily average spectrum:
The last day of available measurements (normally the day before the current day) is projected over the entire EOR trajectory. The maximum integrated spectra estimated for this day over the EOR profile are plotted in blue:
between E>30keV and E>3.MeV for SEM2 data and between E>1.6MeV and E>2.6MeV for ICARE-NG data.
The spectra plotted in red represent the maximum observed by projection on all the ICARE-NG and SEM2 databases. (Dates differ as SEM2 and ICARE-NG data start in 1998 and 2008 respectively).
Maximum spectrum simulated by specification AE8 MAX model along EC7 profile is plotted in black.
The lowest levels of the ICARE-NG spectrum are bounded by the limitations of the projection method for the weakest fluxes (black dashes).
Spectrum history since 2022/01/01
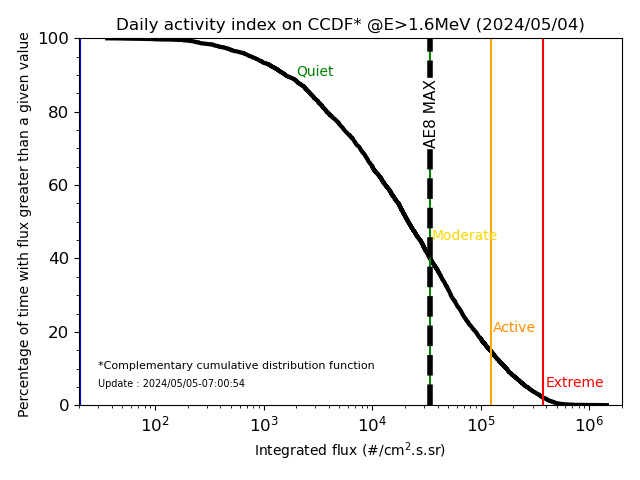
- Daily activity index (@E>1.6MeV) :
The statistic of maximum fluxes projected at the energy E>1.6MeV allows to calculate the complementary cumulative distribution function and
to determine the probability of having a flux level greater than a given threshold.
From this distribution of fluxes, four levels of environmental activity were defined according to the percentage of occurrence of fluxes with an associated color code:
- For the 2% of the strongest fluxes: extreme environment (red level)
- Between 15% and 2% of the strongest fuxes: active environment (orange level)
- Between 40% and 15% of the strongest fluxes: moderate environment (yellow level)
- Below 40% of the strongest fluxes: quiet environment (green level)
The maximum flux observed at the energy E>1.6MeV, by projection on the EOR trajectory for the last day of available measurements (normally the day before the current day) is positioned (blue line)
on the complementary cumulative distribution function (black curve) and thus gives the current activity index against defined levels. AE8 MAX simulation at E > 1.6 MeV calculated along EC7 profile is plotted in black and corresponds
to transition between quiet and moderate environnements.
Index history since 2022/01/01
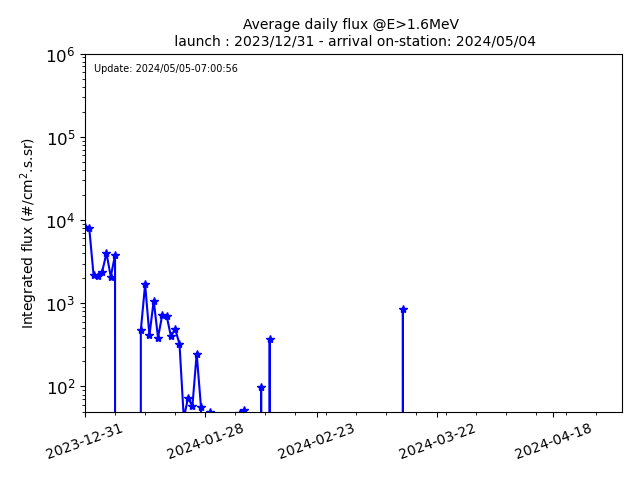
- Average daily flux along EOR scenario (@E>1.6MeV) :
The E>1.6MeV average daily fluxes are projected over the entire EOR scenario, considering the date of arrival on-station in GEO as the last day of available measurements (normally the day before the current day).
The time origin corresponds to the launch date.
Example: if the current day is 2022/05/07 with data available until 2022/05/06, the launch date is 2022/01/01.
Flux history since 2022/01/01
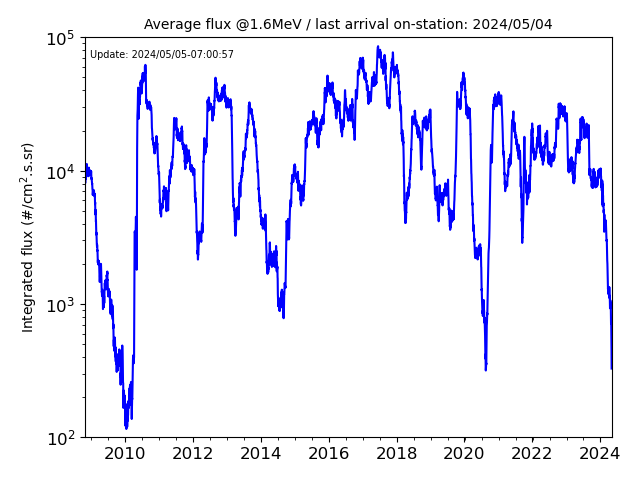
- Average flux at arrival on-station (@E>1.6MeV) :
Thanks to all ICARE-NG data available on JASON-2 and 3 (since June 2008), the average flux received over the entire EOR scenario is estimated at the energy E>1.6MeV
by shifting each day the launch date since 2008/06/22 until the present time. The last plotted point corresponds to the scenario calculated with an arrival on-station in GEO
on the day of the last available measurements (normally the day before the current day).